
|
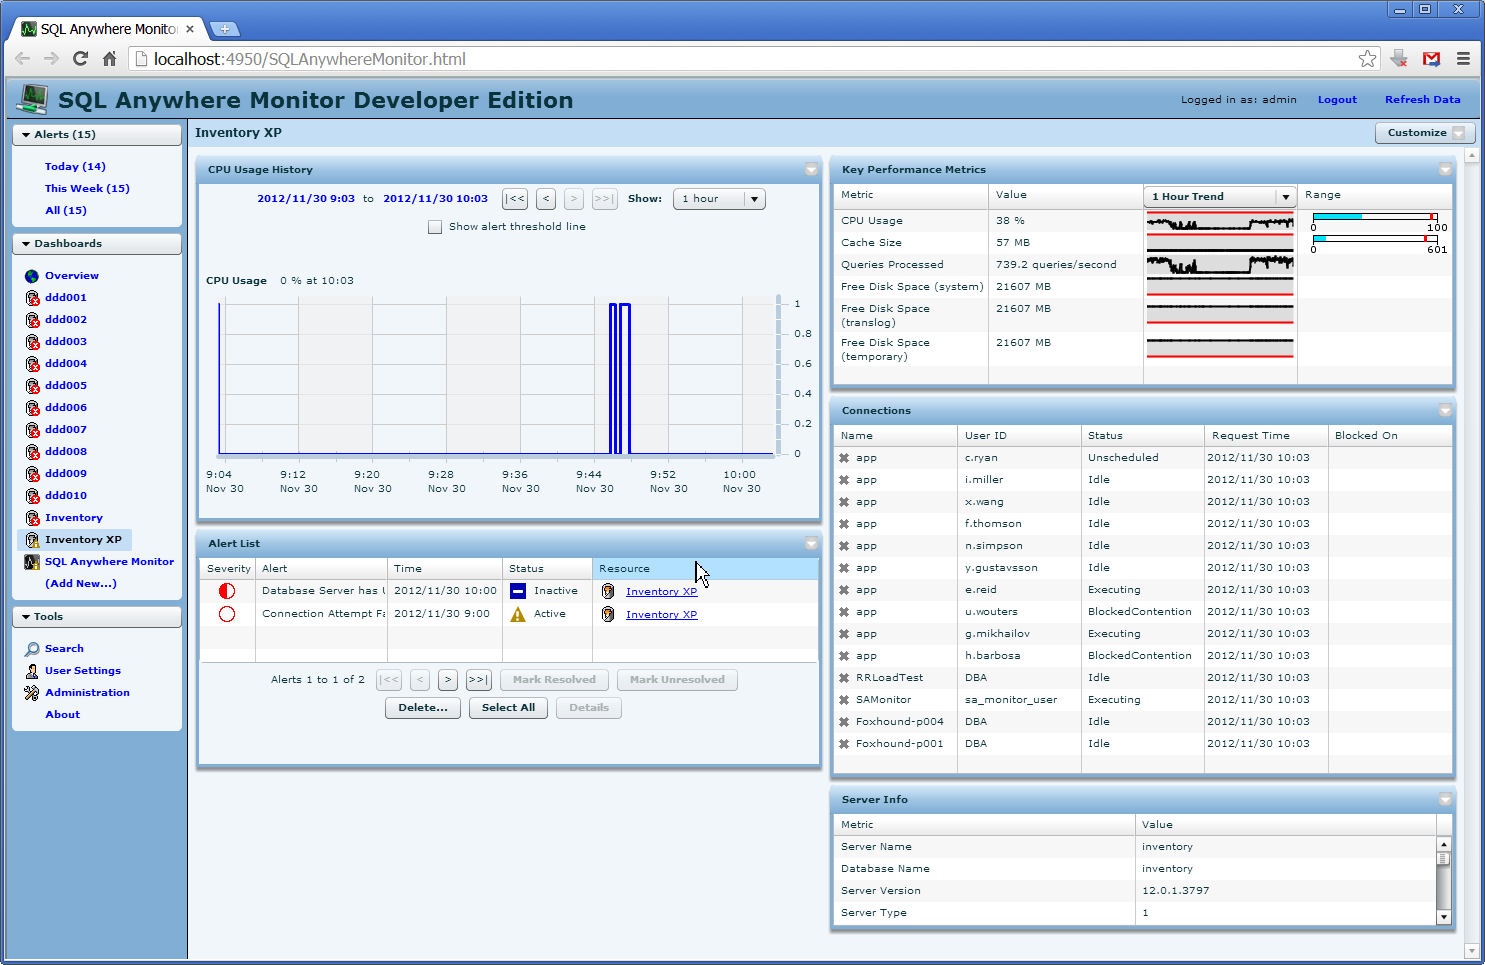
Why would SQL Anywhere Monitor 12.0.1.3810 widgets show vastly different metric values in a Graph display versus a Table display? The following screenshot shows "CPU Usage 0% at 10:03" in the "CPU Usage History" graph on the left, as opposed to 38% in the "Key Performance Metrics" table on the right. (more information after screenshot...)
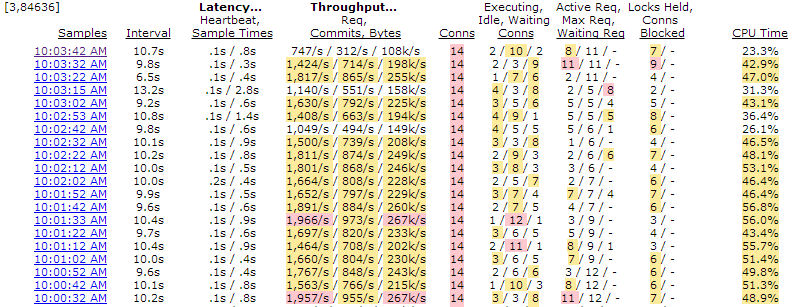
In actual fact (as shown by the following Foxhound screenshot) the CPU Usage has been over 20% on a continuous basis for a long time. This isn't happenstance, the application is pounding the database without pause... there is no way that a CPU usage measurement of 0% could be taken during that period.
|
Please be aware that the SAP SQL Anywhere Forum will be shut down on August 29th, 2024 when all it's content will be migrated to the SAP Community.
Follow this question
By Email:Once you sign in you will be able to subscribe for any updates here
By RSS:Markdown Basics
- *italic* or _italic_
- **bold** or __bold__
- link:[text](http://url.com/ "title")
- image?
- numbered list: 1. Foo 2. Bar
- to add a line break simply add two spaces to where you would like the new line to be.
- basic HTML tags are also supported
Question tags:
question asked: 30 Nov '12, 10:10
question was seen: 2,921 times
last updated: 30 Nov '12, 15:16
Well, are we waiting for a somewhat related announcement?