
|
Update: The first difference isn't quite as significant as first thought; it's all about the Hide SQL/Show SQL button :) The 16.0.0.1691 Plan Viewer displays similar plans differently depending on how the plans were requested. The following images were captured from two plans for more-or-less the same query. The "meat" of the plans are essentially identical; this posting is about GUI differences. Here are the differences...
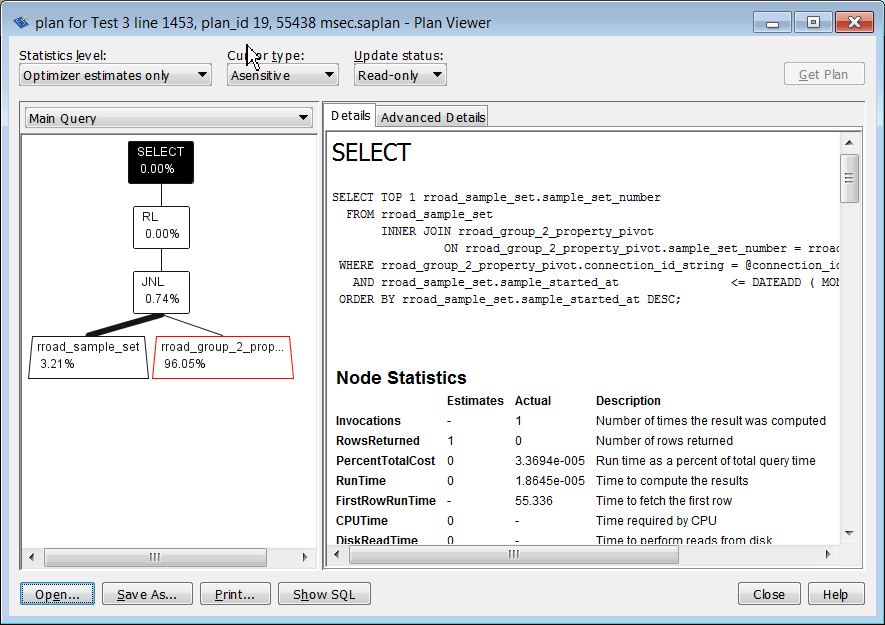
The first image is of a plan captured via the following call to GRAPHICAL_PLAN()... SET @plan = GRAPHICAL_PLAN (
'
SELECT TOP 1 rroad_sample_set.sample_set_number
FROM rroad_sample_set
INNER JOIN rroad_group_2_property_pivot
ON rroad_group_2_property_pivot.sample_set_number = rroad_sample_set.sample_set_number
WHERE rroad_group_2_property_pivot.connection_id_string = @connection_id_string
AND rroad_sample_set.sample_started_at <= DATEADD ( MONTH, -1, @sample_finished_at )
ORDER BY rroad_sample_set.sample_started_at DESC;
',
2, -- Detailed statistics including node statistics
'asensitive',
'READ-ONLY' );
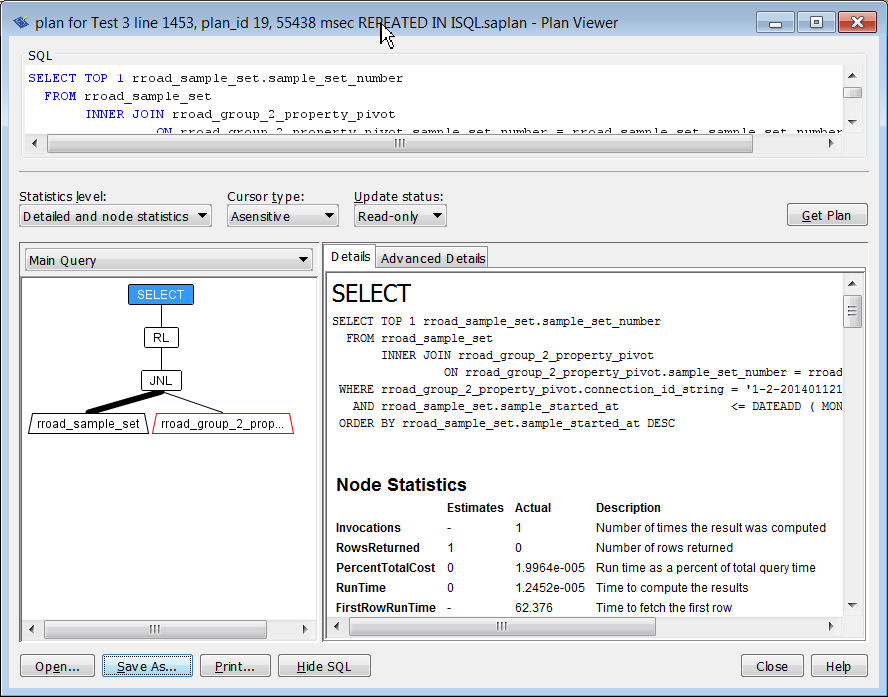
The second image is of a plan for a query run in ISQL.
|
Please be aware that the content in SAP SQL Anywhere Forum will be migrated to the SAP Community in June and this forum will be retired.
Follow this question
By Email:Once you sign in you will be able to subscribe for any updates here
By RSS:Markdown Basics
- *italic* or _italic_
- **bold** or __bold__
- link:[text](http://url.com/ "title")
- image?
- numbered list: 1. Foo 2. Bar
- to add a line break simply add two spaces to where you would like the new line to be.
- basic HTML tags are also supported
Question tags:
question asked: 16 Jan '14, 11:21
question was seen: 2,421 times
last updated: 23 Jan '14, 04:01
For the second one I would like to have the percentages too!