
|
Hi folks, I can see in Sybase Central, Overview panel, in Connected Users frame, Top 5 transaction times. But, it shows Transaction Time with values like 1100 ou more seconds. What does it mean? Does it mean that the connection is executing for 1100 seconds and did not finished yet??? Or does it mean the time the connection is open but it is executing any commands during this time? Thanks!!! |
|
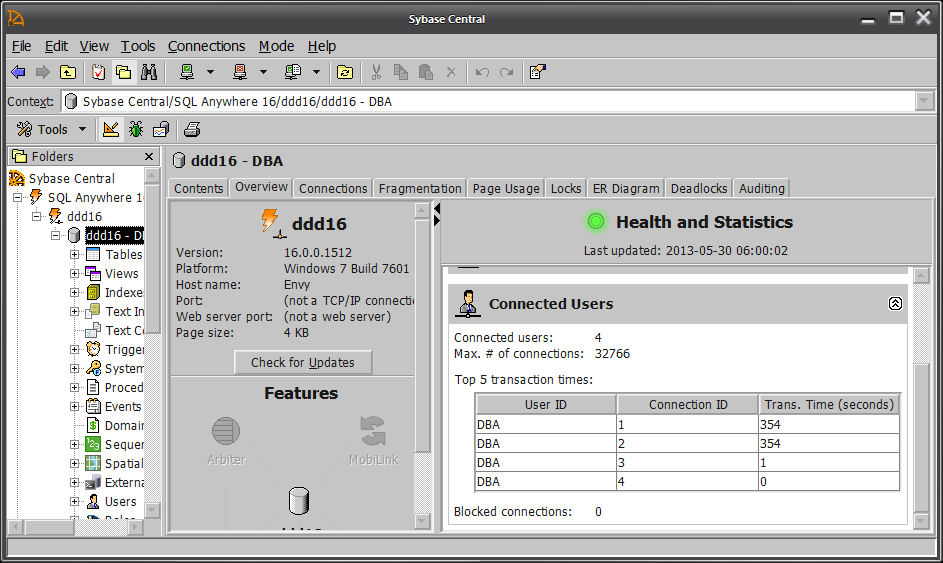
As Mikel indicates, the "Trans. Time" title in Sybase Central is not correct. For example, this screenshot shows four connections that have no outstanding transactions in progress, yet two of the "Trans. Time" numbers keep growing:
What Sybase Central is (apparently) displaying is an elapsed time calculated from the LastReqTime connection-level property. LastReqTime is the timestamp when the last request was started for this connection. In other words, it has absolutely ... nothing ... to ... do ... with transaction time. That can be calculated from the TransactionStartTime connection-level property. In many cases, LastReqTime gives a pretty good idea of which connections are idle, especially when TransactionStartTime is also empty. However, the ReqStatus connection level property also gives a clue, especially since one of its values is 'Idle' :) In other words, you have to carefully define what you mean by "idle"; for example, do you count connections that are doing nothing except blocking hundreds of other connections? Then, once you have a definition, and you understand what statistics SQL Anywhere makes available to you, THEN you can start coding queries... (Note: this query shows an actual transaction in progress; it was NOT run at the same time as the Sybase Central screenshot above.) SELECT Number,
Name,
Userid,
LastReqTime,
IF TRIM ( COALESCE ( LastReqTime, '' ) ) = ''
THEN 0
ELSE DATEDIFF ( SECOND, CAST ( LastReqTime AS TIMESTAMP ), CURRENT TIMESTAMP )
END IF AS "Seconds since Last Request",
CONNECTION_PROPERTY ( 'TransactionStartTime', Number ) AS TransactionStartTime,
IF TRIM ( COALESCE ( TransactionStartTime, '' ) ) = ''
THEN 0
ELSE DATEDIFF ( SECOND, CAST ( TransactionStartTime AS TIMESTAMP ), CURRENT TIMESTAMP )
END IF AS "Transaction Time in seconds",
CONNECTION_PROPERTY ( 'ReqStatus', Number ) AS ReqStatus
FROM sa_conn_info()
ORDER BY Number;
Number,Name,Userid,LastReqTime,Seconds since Last Request,TransactionStartTime,Transaction Time in seconds,ReqStatus
1,'ddd16-2','DBA','2013-05-30 06:41:35.424',3594,'2013-05-30 06:41:35.385',3594,'Idle'
2,'ddd16-1','DBA','2013-05-30 07:41:29.765',0,'',0,'Executing'
3,'Foxhound-p001','DBA','2013-05-30 07:41:23.930',5,'',0,'Idle'
4,'Sybase Central 2','DBA','2013-05-30 07:41:29.047',0,'',0,'Idle'
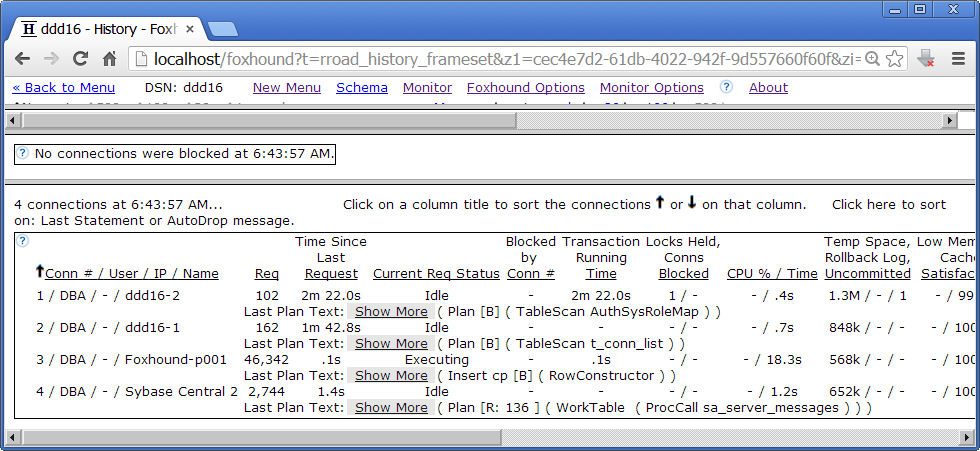
For the record, Foxhound shows all three; "Time Since Last Request" based on LastReqTime, "Current Req Status" based on ReqStatus, and "Transaction Running Time" based on TransactionStartTime. (Note: This screenshot also shows an actual transaction in progress; it was NOT taken at the same time as the query above, or Sybase Central screenshot)
Foxhound also lets you run adhoc queries on historical performance data, like this... -- Long-running queries.
-- Each connection is uniquely identified by sampling_id, connection_number and LoginTime.
-- Each query is uniquely identified by sampling_id, connection_number, LoginTime and LastReqTime.
WITH long_running_query AS
( SELECT sample_connection.sampling_id AS sampling_id,
sample_connection.connection_number AS connection_number,
sample_connection.LoginTime AS LoginTime,
sample_connection.LastReqTime AS LastReqTime,
MIN ( sample_connection.sample_set_number ) AS from_sample_set_number,
MAX ( sample_connection.sample_set_number ) AS to_sample_set_number
FROM sample_connection
WHERE sample_connection.ReqStatus = 'Executing'
AND sample_connection.time_since_last_request > 0
AND TRIM ( COALESCE ( sample_connection.LastStatement, '' ) ) <> ''
GROUP BY sample_connection.sampling_id,
sample_connection.connection_number,
sample_connection.LoginTime,
sample_connection.LastReqTime
HAVING from_sample_set_number <> to_sample_set_number )
SELECT long_running_query.sampling_id AS sampling_id,
IF sampling_options.selected_tab = 1
THEN 'DSN'
ELSE 'String'
END IF AS connection_type,
sampling_options.selected_name AS target_database,
long_running_query.connection_number AS connection_number,
long_running_query.to_sample_set_number AS sample_set_number,
long_running_query.LoginTime AS LoginTime,
long_running_query.LastReqTime AS started_at,
sample_header.sample_finished_at AS recorded_at,
CAST ( sample_connection.time_since_last_request / 1000 AS BIGINT ) AS elapsed_seconds,
sample_connection.LastStatement AS LastStatement
FROM sampling_options
INNER JOIN long_running_query
ON long_running_query.sampling_id = sampling_options.sampling_id
INNER JOIN sample_header
ON sample_header.sampling_id = sampling_options.sampling_id
AND sample_header.sample_set_number = long_running_query.to_sample_set_number
INNER JOIN sample_connection
ON sample_connection.sample_set_number = long_running_query.to_sample_set_number
AND sample_connection.connection_number = long_running_query.connection_number;
Once again, I recommend this blog post. Thank you guys! Thank you Mr. Carter! Perfect answer! Best regards! Roger
(03 Jun '13, 11:14)
Roger
Replies hidden
@Roger: I have felt free to turn your "answer" into a comment - you can do so yourself (i.e. to add a comment) with the help of the "add new comment" button below each question/answer...
(03 Jun '13, 11:21)
Volker Barth
|
|
Hi Roger, The value displayed under Transaction Time is time since the last request was received on that connection. Large numbers under transaction time should not be a cause for concern as they may just be idle clients. Thank you, Mikel. So, How can I identify the active and idle connections? (via query) Because, using "sa_conn_info" I cannot see the difference... Thanks! Roger
(29 May '13, 16:19)
Roger
Replies hidden
1
I should clarify, when I say idle clients, I just mean clients that have not made a request in some period of time. SQL Anywhere does not differentiate. The query: SELECT "t1"."number",value from sa_conn_info() as "t1" join sa_conn_properties() as "t2" on "t1"."Number" = "t2"."Number" where PropName='YourPropName' Allows you to view the state of any connection property (including last request time) that is listed in: http://dcx.sybase.com/index.html#sa160/en/dbadmin/connection-properties.html The result of the query shows the value for each connection number, as specified in call sa_conn_info() If you’re just interested in which clients are idle, call sa_conn_info() contains the last request time for each client
(29 May '13, 17:45)
Mikel Rychliski
Don't get hung up on sa_conn_info(), it is only one of very many methods to use to get performance information. SQL Anywhere is very different from Oracle in this respect; Oracle uses views for everything, which leads one to believe that performance data is somehow stored in the database, whereas SQL Anywhere provides built-in functions which you call to get performance statistics from the server. Mikel has given you links into the Help; have you read these? I gave you a link to a blog post; have you looked at it? If you want to do-it-yourself with queries rather than use a tool, then you have to do some of your own homework.
(30 May '13, 05:42)
Breck Carter
|